The RFM model refers to Recency, Frequency & Monetary value (RFM). It is a marketing analysis tool used to identify the best customers of a company, based on the nature of their spending habits.
How should I interpret the model segments?
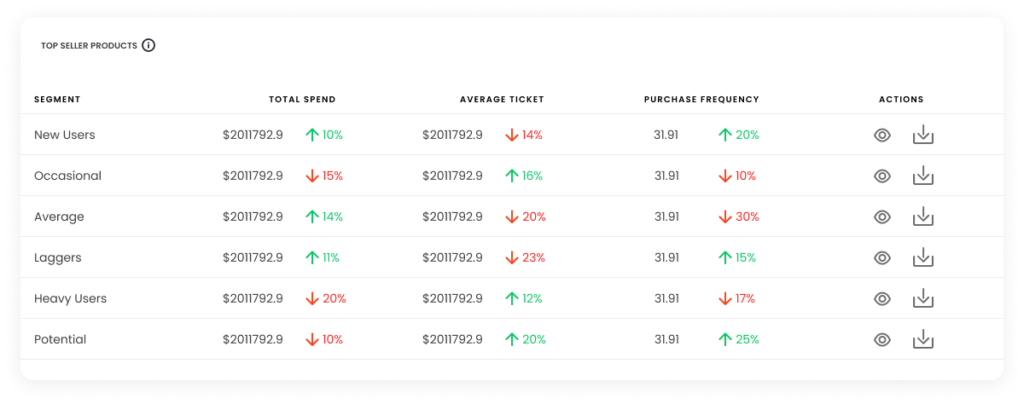
Within the graph you can identify 8 types of customers, below we describe the definition of each one:
- New users
- They are new users who have not made a purchase in the last 3 months.
- Loyals
- They are users who buy very recurrently in Rappi but do not have a high ticket per purchase occasion.
- Laggers
- They are users who have a purchasing pattern that lags behind the category average.
- Average Users
- They are the users who are identified as having a behavior similar to the category average.
- Potential Heavy Users
- They are users who have very good shopping habits who make recurring purchases and with good levels of spending per occasion.
- Heavy Users at Risk
- They are Heavy Users who are at risk since their purchase recency has increased.
- Heavy Users
- They are the users with the highest spending in the category and make recurring purchases within the category or brand.
- At-Risk
- These are users who, in addition to having a lagging behavior, have very distant purchase recency with respect to the category average.
You will also find the total expenditure for each of the segments present in your search, its average ticket and purchase frequency with the comparison to the previous period.