Our Sampling reports are divided on 3 main categories.
- Execution. Details of units delivered to users, geolocation and general attitubes of those impacted users. Answers the following questions:
- How many units were delivered?
- Where were those units delivered?
- Who received those units?
- Behavior. This is where we talk about the tendencies and re purchase of the product, your brand and the category trend during that same period of time. Answers the question, how was the user consumption before and after the campaign? considering 3 variables:
- Delivered product
- Brand of the delivered product
- Category of the delivered product
- Surveys. If your campaign included a product survey at the end here is where you will find users answers. This is the cualitative section of our report where you can see real feedback from your impacted users.
Execution
| Metric | Description |
| Units delivered to Rappi | Total amount of units that were delivered to our warehouses for the campaign. |
| Units delivered to users | Total amount of units that were successfully delivered to consumers. |
| Users impacted | Total number of unique customers that got samples delived for the campaign. |
| Gender | Percentage distribution of females vs male users impacted. |
| Age | Percentage distribution of ages of the users impacted. |
| Lifestyle | Percentage distribution of spend inside of Rappi of the users impacted. |
Depending on how you decide your campaign set up we can have multiple samples delivered per user (ex. 2 units per user), if that is the case you will see that the number of impacted users is going to be around half the amount of samples delivered to Rappi.
Tip
Iniside this report you will also find a heatmap to show the impacted zones, this helps you to understand in a more graphical way where we delivered your samples to consumers.
Finally segmentation criteria is listing all the characteristics that where initially defined to obtain the data base of users to be impacted for this campaign, this can be as specific as you want but please have in mind that as you add more variables your consumer base will reduce so it is important to have a converstion around your expectation of units to be delivered vs how specific you want your criteria to be.
Behavior
At the top of this report you will find a selector for frequency and period. What you select here is going to determine how data is presented inside all the graphs of this report.
| Metric | Description |
| Frequency | Refers to the aggregation periods for the data |
| Period | Determines the period you will be see reflected on the graph, before and after the impact. |
Inside this report you will find the impacted users trend in terms of product, trademark and category.
It is very important to have in mind that the graphs will only show behavior of the impacted users, not the total universe of users that buy your products.
Tip
Also, have in mind that the are some campaign that were set up with multiple EANs, one principal EAN for the product you sampled (Ex. Lemon dishwasher 250ml) and secondary EANs to track additonal presentations (Ex. Lemon dishwasher 500ml and Lemon Dishwasher 1L). All of those EANs will be reflected at your Product trend on Impacted users graph.
Remember to specify those secondary EANs since the begining of the process, while setting up your campaign so your reports reflect all the data you need.
Tip
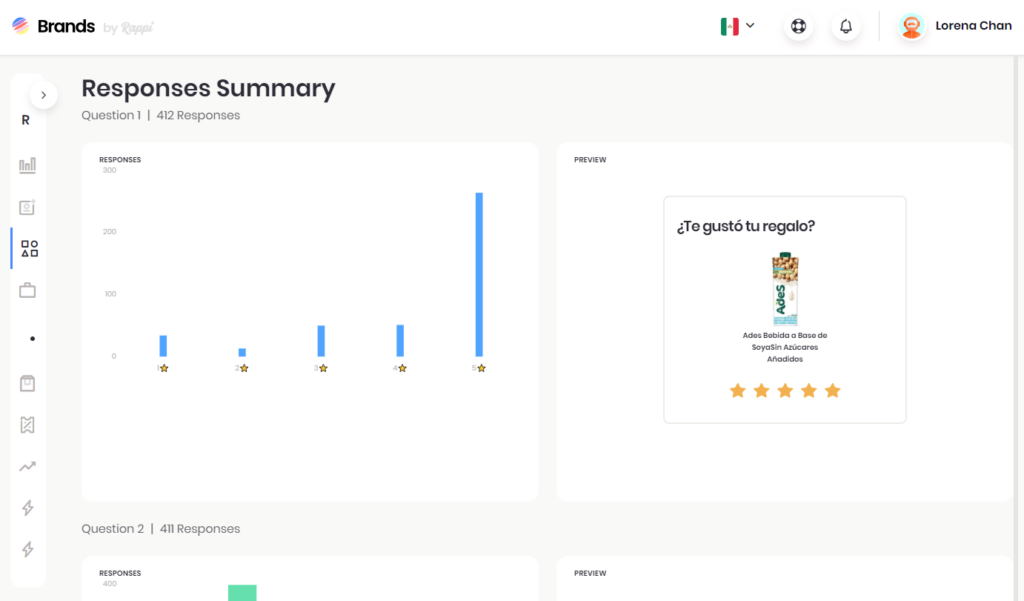
Surveys
After users where impacted and they confirmed that the sample was delivered, we will send them a small survey to understand their perception around the delivered sample and the sampling experience. you can find this at the third tab of the report and data is updated every day just like the rest of the report sections.