Shopper Behaviour
| Metric | Explanation | Formula |
| Number of buyers | Unique buyers in selected period | |
| Sales | Sales in selected period | |
| Orders | Unique Orders in selected period | |
| Purchase Frequency | How many orders on average a user makes in selected period | Unique orders / number of customers |
| Average Ticket | The average order value in selected period | Total value / Number of order |
On the top right corner of the section Shopper Behaviour, you can click the button “Compare to Category” to display all of the metrics in this section compared to the category.
Tip
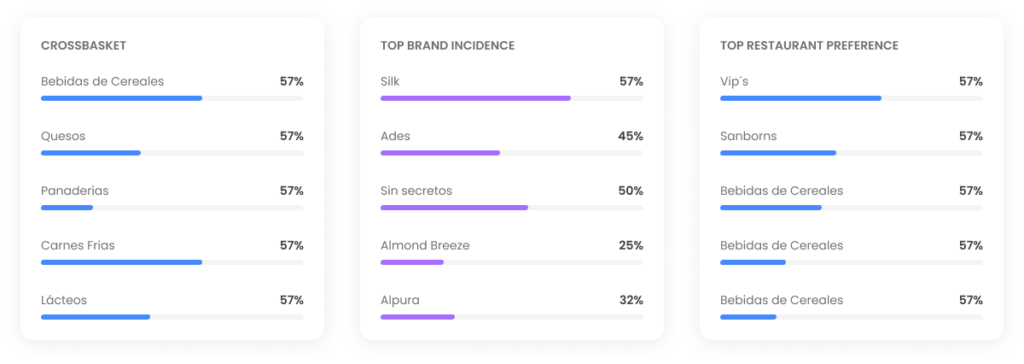
Shopper Preferences
| Metric | Explanation | Formula |
| Cross Basket | Afinity with other categories, Which are the top other categories users are buying when they are buying my products? | Orders to other categories / Orders to selected category |
| Top Brand Incidence | Afinity with other brands that play in the same category as the one being analyzed | Orders to other brands in the same category / Orders to selected category |
| Top Restaurant Preference | Afinity with restaurants, Which are the top restaurants users are buying when they are buying my products? | # of orders to restaurants by users buying from selected category |
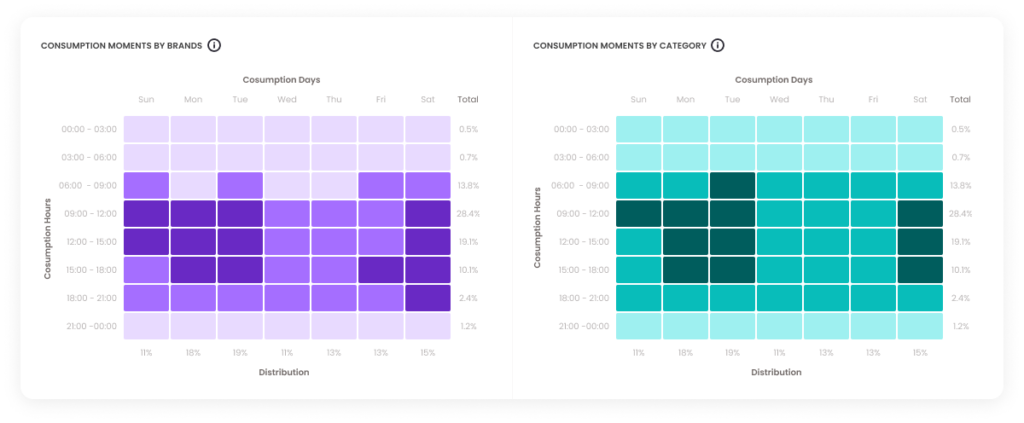
High Consumption Moments
| Metric | Explanation | Formula |
| Consumption moments by brand | The moment of purchase of the user for the brand (By day of the week and hour of the day) | Brand Orders in a range of time by day / Brand total orders |
| Consumption moments by category | The moment of purchase of the user for the category (By day of the week and hour of the day) | Category Orders in a range of time by day / Category total |
Hovering over the distribution graph will show the % of overall consumption, and on the right side it will display the total % by range of time and at the bottom the % total by day.
Tip
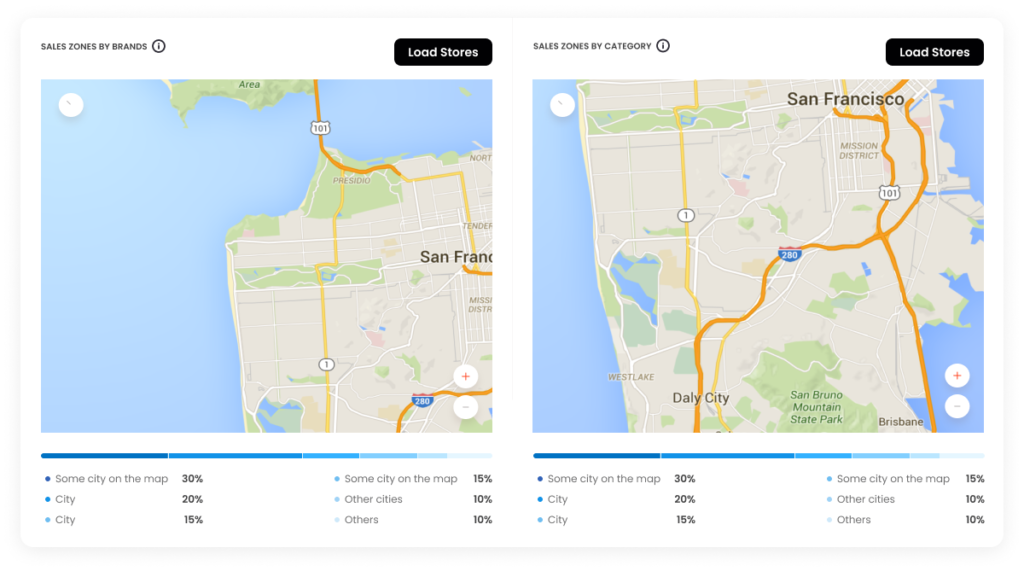
Geolocalization of Active users
| Metric | Explanation |
| Sales zones by brands | Heatmap and stores in which the users bought the brand. |
| Sales zones by category | Heatmap and stores in which the users bought the category. |
Click in “Load Stores” to see retailer details. Share of users by city will be displayed below the map.
Tip
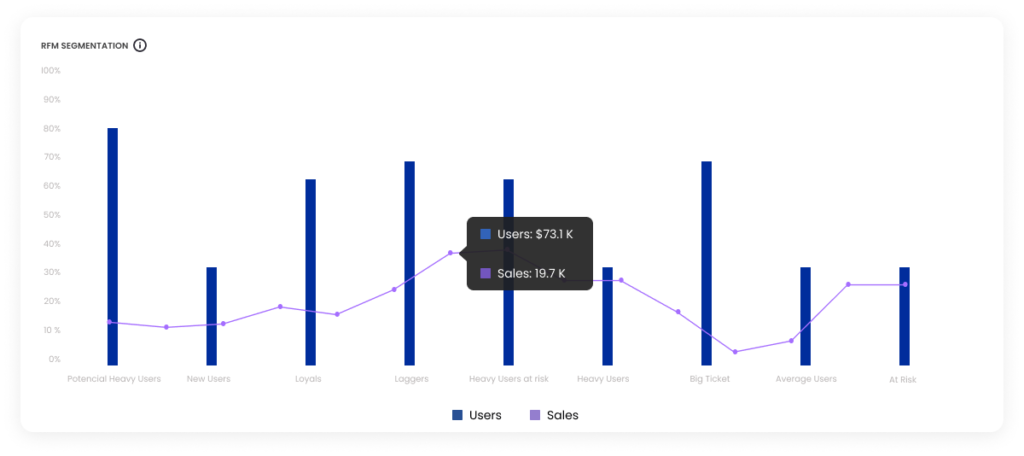
Segment Analysis by RFM
| Metric | Explanation |
| Heavy Users | – Users with the greatest spend in the category / Brand – Purchase recurringly – Are brand promoters |
| At risk | – Low purchase frequency – Average Ticket and frequency are below de average of the other segments |
| New Users | Users that havent made a purchase in the last 3 months |
| Potential Heavy Users | – Have great purchasing habits – Are recurringly buying the brand or category with a good amount of purchase per order |
| Laggers | Users that mantain a tendency of purchase below the cateogories average |
| Loyals | – Recurrent users and buyers of Rappi – They dont show a high ticket nor a high frequency in their purchases |
| Average Users | Users that show a similar behaviour than the average of the category |
| Heavy Users At Risk | – Users with the biggest spend in the brand / category – Their last purchase is farther than the Heavy user for the period analyzed |
Hover over the bar graphs in the RFM segment to see the % of weight users and sales represent on overall segments.
Tip
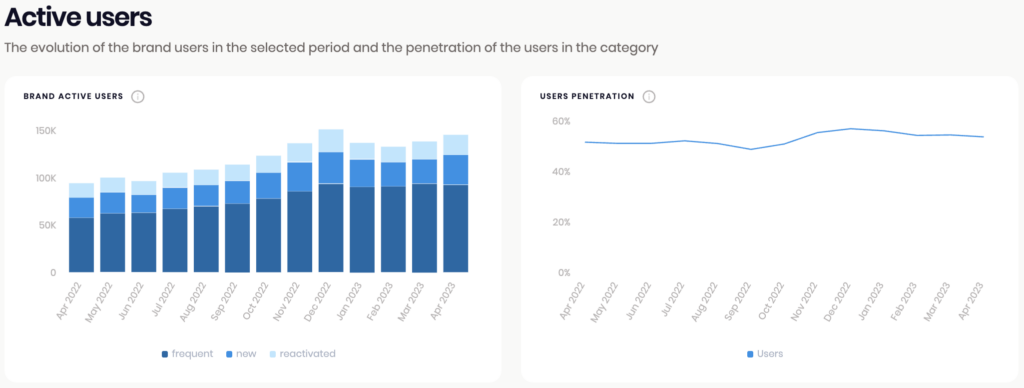
Active Users
| Metric | Explanation | Formula |
| New Users | Users who had never made a purchase before. | |
| Reactivated Users | Users who had not made a purchase for at least three months. | |
| Frequent Users | Users who have made at least two purchases in the last three months. | |
| User Penetration | The penetration of the users in the category. Of all the users that buy the category what % is buying my brand? | Users that buy the brand / total users that buy de category |
Hovering over the brand active users will display a tooltip showing the split of users by frequent and new.
Tip
Hovering over the Users penetration trendline will show the total % of users penetration as well as the split by frequent and new users.
Tip
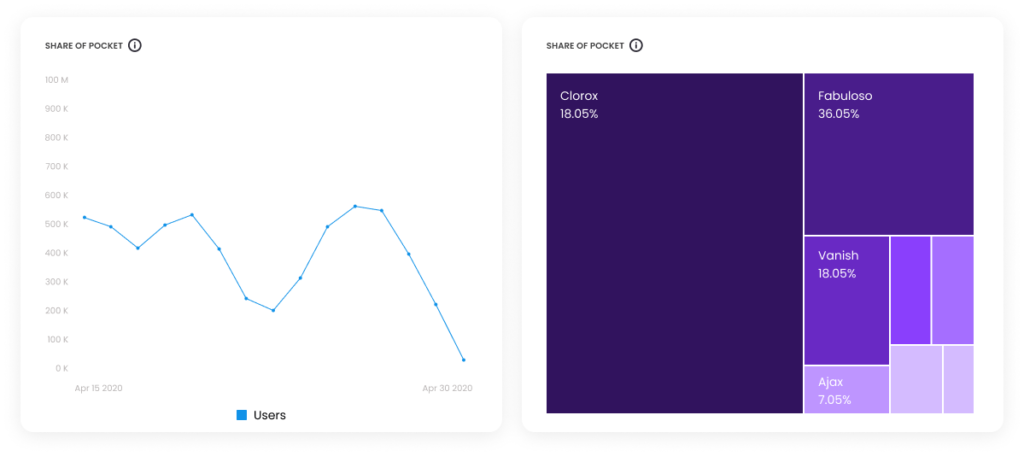
Share of Pocket
| Metric | Explanation | Formula |
| Share of Pocket | Of the total orders users make to the category being analyzed: How many have the maker category in it? | Brand Orders / Total orders to the category the brand plays in |
| Share of Pocket Preference | Of the total users spend. What % is being allocated to the different brands that play in the category? | Spend in brand / total spend in category |
Hovering over Share of pocket trendline will show the total % of orders that include the brand in them.
Tip
Hovering over the boxes by brand will display the % of share.
Tip