Indicators
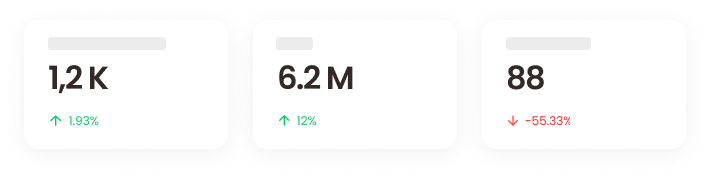
| Metric | Explanation | Formula |
| Brand Sales | Sales in selected period | |
| Brand Users | Unique buyers of the brand in selected period | |
| Brand Orders | Unique Orders of the brand in selected period | |
| Brand Share Sales | The importance of your brand within the selected category in the accumulated period. | Brand sales / Category sales |
| Category Sales | Sales of the category or categories selected in the same period | |
| Category Users | Unique buyers of the category in the selected period | |
| Category Orders | Unique Orders of the category in the selected period |
Bottom variation is the comparison within the same time range against the prior period.
Tip
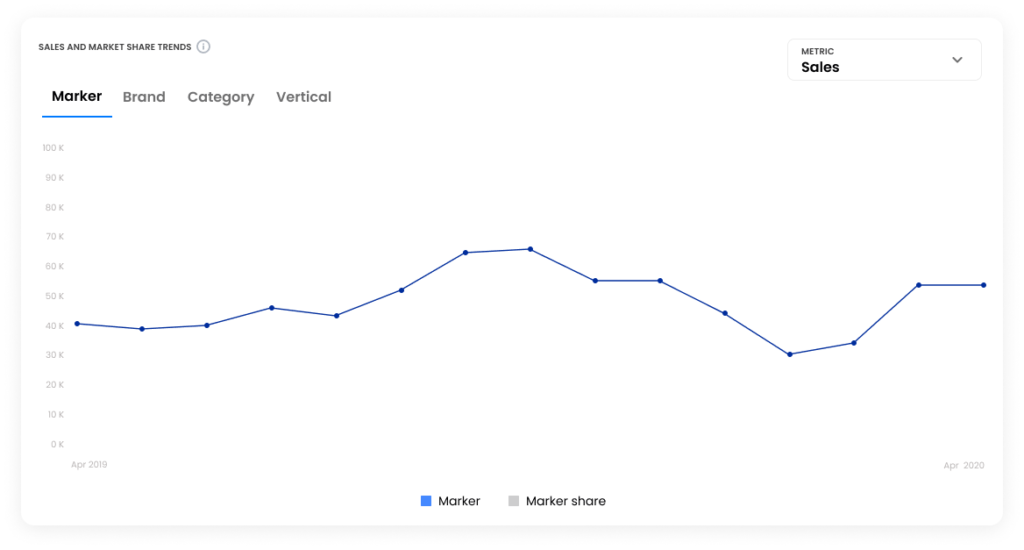
Sales Evolution
| Metric | Explanation |
| Maker | Trend of your sales and market share disaggregated according to your selection of periods (daily, weekly, monthly and quarterly). Here you can compare you as a maker vs the category selected. *If a specific brand was selected, here you will see the total maker sales in the categories where the selected brand participates |
| Category | Trend of your sales and market share disaggregated according to your selection of periods (daily, weekly, monthly and quarterly). Here you can compare your brand in the different categories in which it participates |
| Brand | Trend of your sales and market share disaggregated according to your selection of periods (daily, weekly, monthly and quarterly). Here you can compare your different brands. |
| Vertical | Trend of your sales and market share disaggregated according to your selection of periods (daily, weekly, monthly and quarterly). Here you can compare the different verticals (Super, Express Pharmacy, Liquor) in which it participates. |
Remember that displayed data depends on the selected filters, for example, if you select all your brands and all your categories you will have the complete maker vision and you will see multiple lines in the category and brand tabs.
Tip
To see it in terms of share, change it in the drop-down list that is in the upper right part, when you pass the mouse over the graph you will be able to see the Share / sales detailed.
Tip
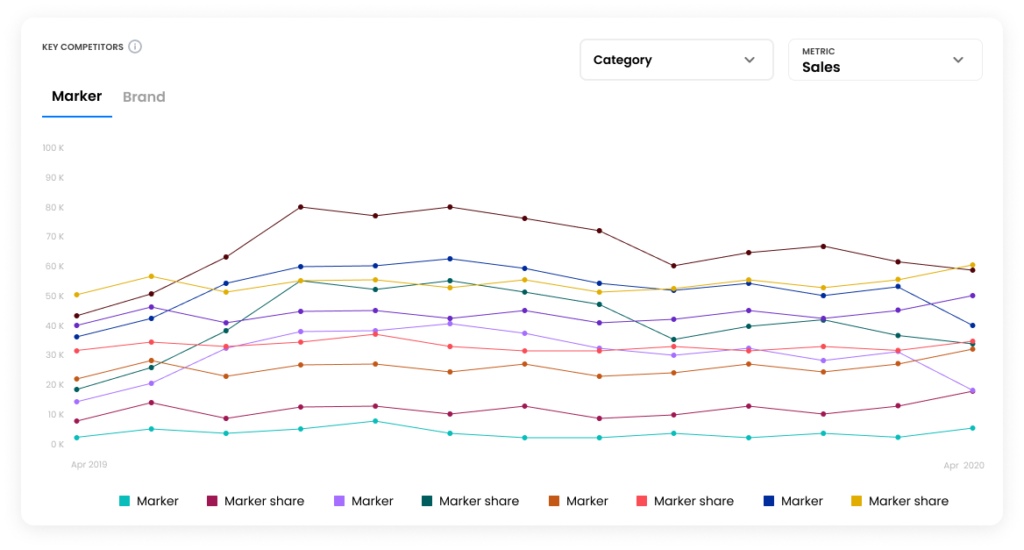
Key Competitors
| Metric | Explanation |
| Maker | Analyze the top makers competitors in the selected category. |
| Brand | Analyze the top brand competitors in the selected category. |
In order to view this module, you must first select a category to analyze in the drop-down list and calculate the corresponding Market share. Remember to change from sales to share to see it as a percentage. When you pass the mouse over the graph you will be able to see the Share / sales of each brand.
Tip
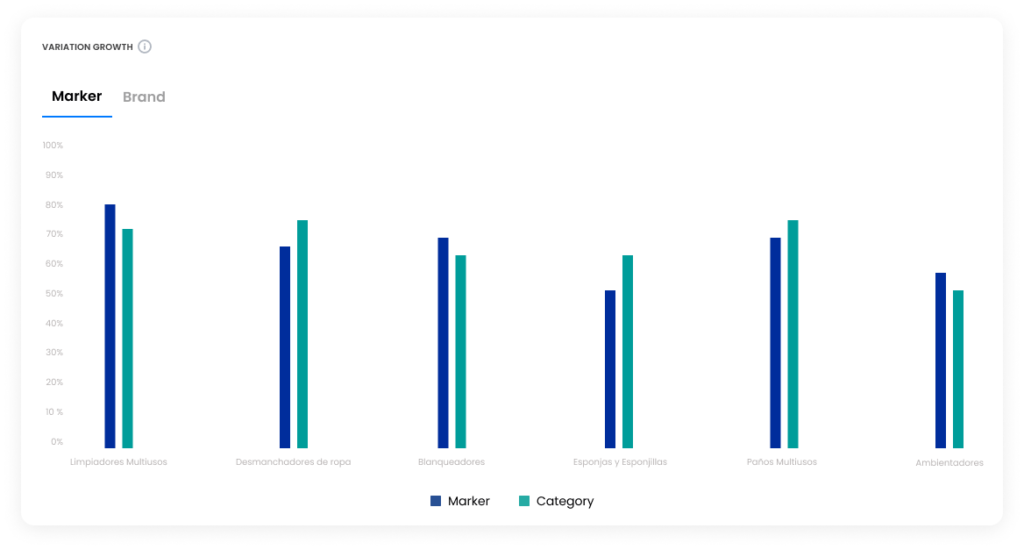
Growth Tendencies
| Metric | Explanation |
| Category | Analyze your growth vs the category. Here you will see the variation open by the selected categories in the accumulated period. |
| Brands | Analyze your growth vs the category. Here you will see the variation against the previous period taking into account the selected data aggregation. |
Frequency
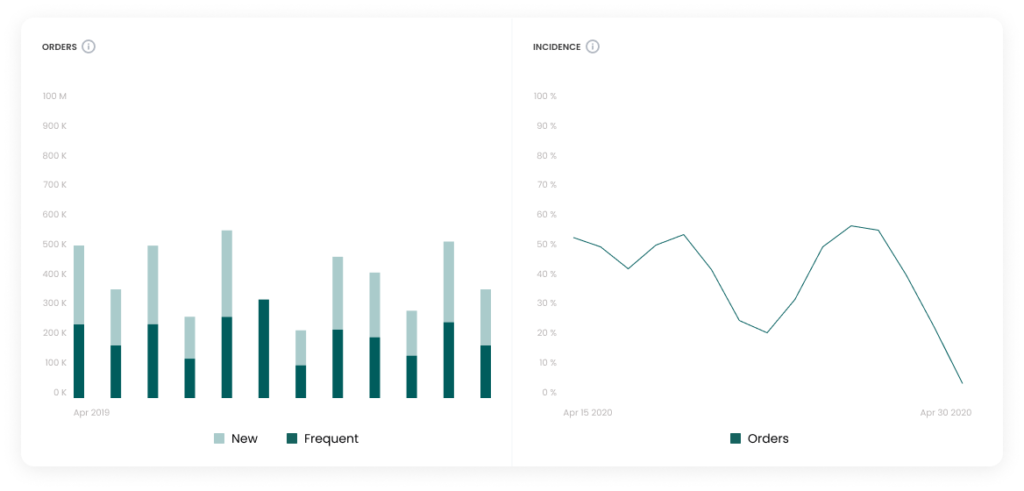
| Metric | Explanation | Formula |
| Orders | Orders graph shows your brands total orders according to the selected data aggregation. Broken down by orders generated by frequent users and orders generated by new users to your brand. | |
| Incidence | Incidence graph shows the percentage of the orders belonging to your brand with respect to the total orders placed in the category. | Brand Orders/Category Orders |
A user is considered frequent if it had placed an order in the last 6 months.
Tip
Vertical Details
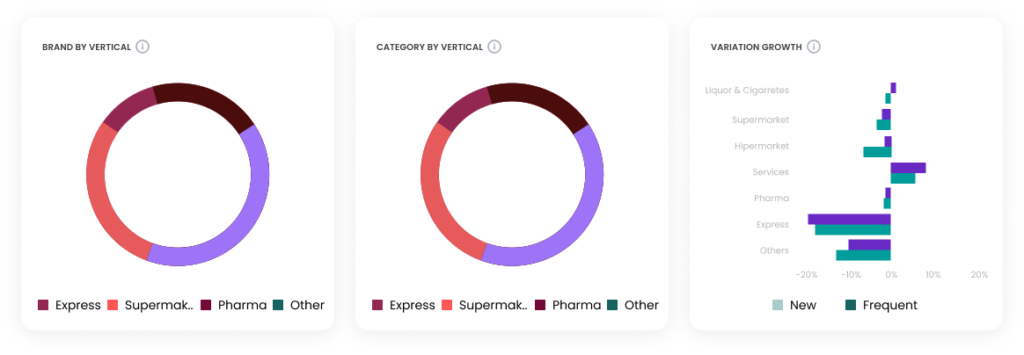
| Metric | Explanation |
| Brand by Vertical | Here you can see the distribution of your brand sales between the verticals of Rappi. |
| Category by Vertical | Here you can see the distribution of the category sales between the verticals of Rappi. And compare it to the one of your brand. |
| Variation Growth | Here you will see the variation of each vertical in the selected period of time. |
By clicking on each of the verticals you will see the mix by retailer.
Tip
Product Breakdown
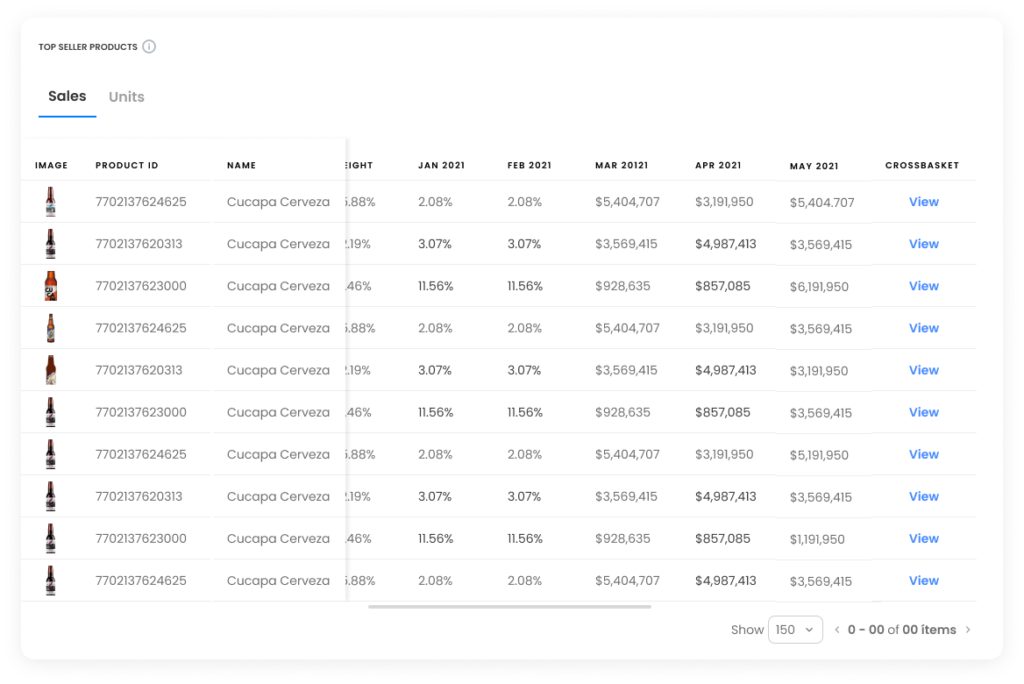
| Metric | Explanation |
| Top Seller products | In this module you will see the top SKUS of your brand, its weight, its variation and its sales according to the selected data aggregation. |
If you move the bar to the right you will see the View button and by clicking it, it will show you the top cross basket of this SKU and the percentage of orders in which is present.
Tip