What Is Campaign Reports?
Campaign Reports is a section where you can analyze the most relevant metrics and the performance of your campaigns with Rappi Ads for Brands.
Here, you will find the results of all campaigns that have been running for at least one day, with all data updated up until the end of the previous day.
Reports are grouped based on campaign objectives. Depending on your campaign type, you will see metrics such as:
- Awareness: Impressions, unique reach, frequency, and deliveries.
- Engagement: Clicks, CTR, Add-to-Cart (ATC), and Opens.
- Conversion: Attributed sales, attributed orders, and ROAS.
Key Features of the Module
✅ 24/7 Metrics & Next-Day Data: Access your campaign performance up to the previous day, anytime you need it—no need to wait until the end of the campaign.
✅ Full-Funnel View: Get detailed metrics for each stage—awareness, engagement, and conversion. Impressions, clicks, and sales, all in one place.
✅ Unified Sales Attribution: Understand how an upper-funnel action within Rappi drives sales results.
✅ Advanced Tools: Use filters, breakdown tables, and graphs to download and analyze data in depth, enabling more informed decision-making.
How Do the Filters Work?
Report filters allow you to create a flexible analysis by exploring parameters that match your search and business needs.
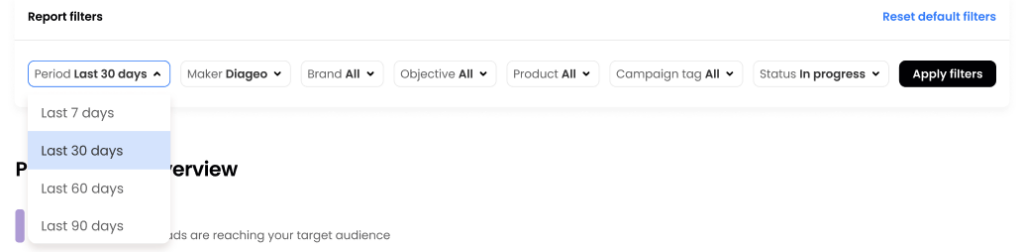
- Period: Available time frames: 7, 30, 60, and 90 days. Data is displayed up until one day before the consultation date.
- Brand: Select one or multiple sub-brands under the main Maker.
- Objective: Choose according to your analysis goal:
- Awareness products: In-app, corridor banner, home banner, mailing, order tracker, pop-out carousel, push notification, search banner, SMS, splash, sponsored banner, vertical banner.
- Conversion products: Sponsored product.
- Product: Select one or more Ads products based on your strategy.
- Campaign tag: Identifiers associated with your campaign request, allowing you to group campaigns by strategy, e.g., Back to School, Summer 2025, Christmas, etc.
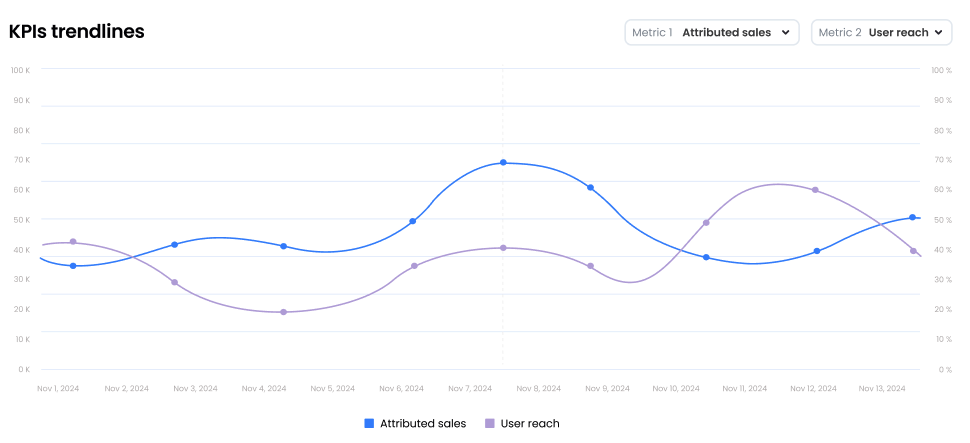
KPI Trendline Graph
This feature allows you to visualize your campaign’s performance over the selected period. The metrics available for comparison are:
- Attributed Orders
- Attributed Sales
- Clicks
- CTR
- Impressions
- ROAS
Select one or two metrics to compare and view trends over the selected period. The X-axis represents time periods, while the Y-axis shows the values for each compared metric.
Campaign Breakdown
Access individual reports for the campaigns included in your selected parameters. View dates, statuses, and key metrics for each campaign.